About the Dashboard
The Dashboard comprises a number of widgets that provide a global understanding of transactions![]() An executed business process that is associated with an account. The transaction applies credentials for the account to a workflow and contains the decision rendered by the workflow. and related data in the portal. Each widget focuses in on a particular area of interest, such as transactions processed for each document or product type, the number of new customers your organization has processed through Jumio, or a breakdown of transactions processed in each country.
An executed business process that is associated with an account. The transaction applies credentials for the account to a workflow and contains the decision rendered by the workflow. and related data in the portal. Each widget focuses in on a particular area of interest, such as transactions processed for each document or product type, the number of new customers your organization has processed through Jumio, or a breakdown of transactions processed in each country.
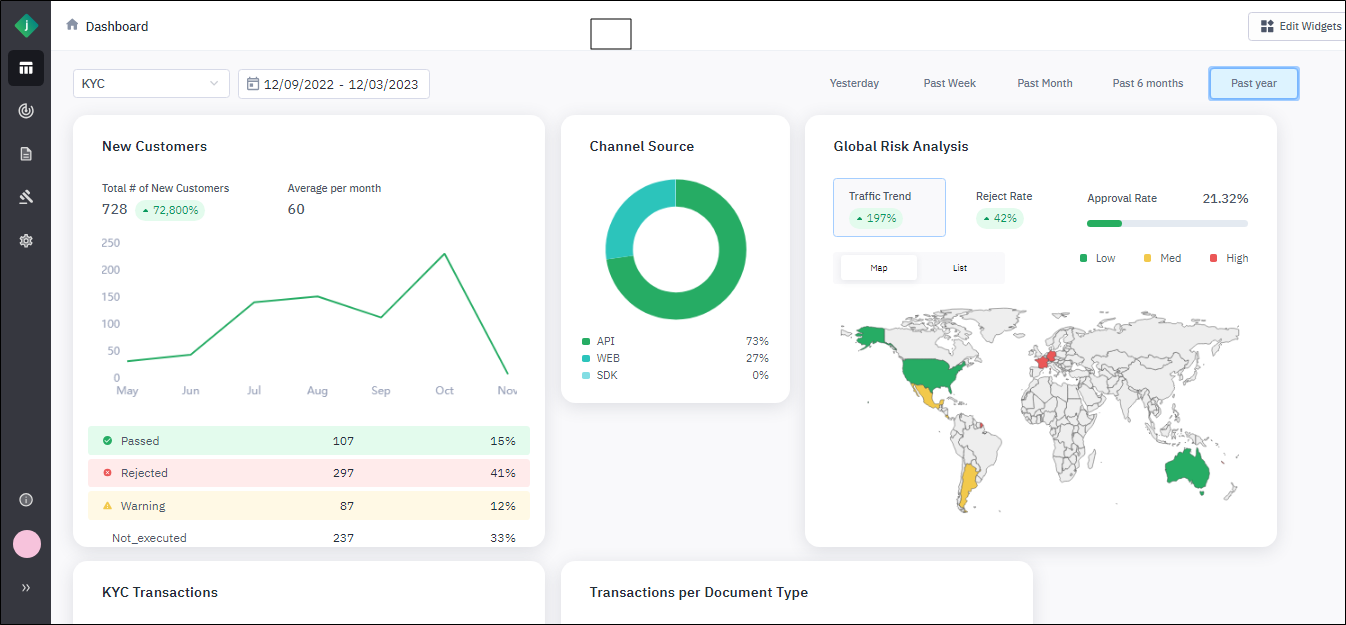
You can filter the data shown in the widgets by selecting a time frame from the dashboard. The selected time frame will be applied to all widgets.
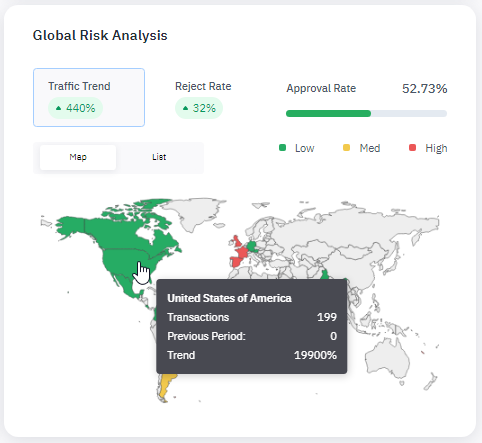
The widgets are interactive, allowing you to select an option that offers a different view of the information or hover over a map or graph to see more specific data. For example, the default view of the Global Risk Analysis widget is a color-coded map you can hover over to view the traffic trend for a particular country's total transactions.
If you select Reject Rate, the data displayed on hover changes to a breakdown of the number of transactions assigned a risk score of Approved, Warning, or Rejected.
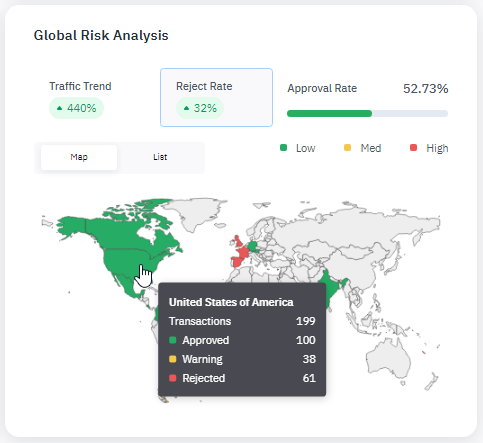
Furthermore, you can change the map view to a list of countries by selecting List. Capabilities similar to these are found in the other widgets.
